Javascript 曲线表作图库
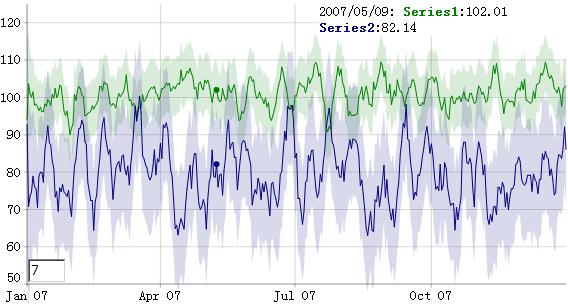
dygraphs 是一个开源的Javascript库,它可以产生一个可交互式的,可缩放的的曲线表。其可以用来显示大密度的数据集(比如股票,气温,等等),并且可以让用户来浏览和解释这个曲线图。在它的主页(http://www.danvk.org/dygraphs/),你可以看到一些示例和用法。
要使用这个库,很简单,只需要包括[dygraph-combined.js](http://github.com/danvk/dygraphs/downloads/)文件,其文件尺寸很经济,也就45K。
<script type="text/javascript"
  src="dygraph-combined.js"></script>
下面两个示例,你可以把数据写在javascript中,也可以设置一个csv文件。
示例一,你可以在代码中指定数据
<div id="graphdiv"></div>
<script type="text/javascript">
  g = new Dygraph(

    // containing div
    document.getElementById("graphdiv"),

    // CSV or path to a CSV file.
    "Date,Temperature\n" +
    "2008-05-07,75\n" +
    "2008-05-08,70\n" +
    "2008-05-09,80\n"

  );
</script>
示例二、你可以引入外部的CSV文件。([temperatures.csv](https://coolshell.cn/wp-admin/temperatures.csv))
<div id="graphdiv2"
  style="width:500px; height:300px;"></div>
<script type="text/javascript">
  g2 = new Dygraph(
    document.getElementById("graphdiv2"),
    "temperatures.csv", // path to CSV file
    {}          // options
  );
</script>
(转载本站文章请注明作者和出处 酷 壳 – CoolShell ,请勿用于任何商业用途)


